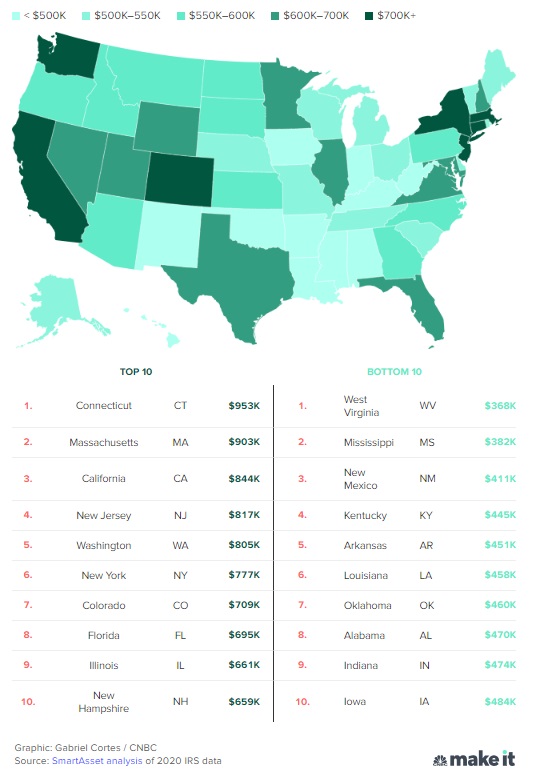
Earning enough money to be among the top 1% of earners is a significant achievement in any state. A recent analysis by SmartAsset reveals the income thresholds required to enter this exclusive club vary greatly across the United States. From Connecticut to West Virginia, the income disparities shed light on the diverse economic landscapes present in each state. Understanding these figures can provide valuable insights into wealth distribution and economic opportunities across the country.
Income Disparities Across States
According to SmartAsset’s analysis, Connecticut boasts the highest income threshold for the top 1%, requiring a staggering $952,902 annually. In contrast, West Virginia has the lowest threshold at $367,582. These figures highlight the vast income disparities between these two states.
Connecticut’s median household income of $90,730 is among the highest in the nation, well above the national median of $74,580, as reported by the Census Bureau. On the other hand, West Virginia’s lower threshold can be attributed to its lower cost of living and relatively lower median household income.
Regional Trends
The analysis reveals that the Northeast dominates the rankings, with five out of the ten states with the highest income thresholds for the top 1% located in this region. These Northeastern states have an average income requirement of $696,358, surpassing the national average of $652,657. In contrast, Southern states tend to have lower income thresholds, with an average income of $526,592 necessary to be among the top earners in those regions. The Midwest falls somewhere in between, requiring an average income of $544,525 to enter the top 1%.
Implications and Economic Opportunities
Understanding the income thresholds for the top 1% in each state provides valuable insights into economic disparities and opportunities. Higher thresholds in certain states may indicate a greater concentration of wealth and economic inequality. Conversely, lower thresholds in other states may suggest a more equitable distribution of resources and a lower cost of living.
These figures also shed light on the different economic opportunities available. States with higher thresholds may offer more lucrative job prospects and a higher cost of living, while states with lower thresholds may provide a more affordable lifestyle.
Conclusion
The income requirements to be part of the top 1% in each U.S. state vary significantly, reflecting the economic diversity and disparities across the nation. From Connecticut’s high-income threshold to West Virginia’s lower requirement, each state presents unique economic opportunities and challenges. Understanding these figures can help policymakers, economists, and individuals gain insights into wealth distribution and economic landscapes, paving the way for more informed discussions on income inequality and economic development.
Source: CNBC


